Excel Pivot Tables
Pivot Tables are an extremely powerful tool for displaying information in a spreadsheet. Pivot Tables allow data to be grouped together to provide increasing levels of detail. These groupings can be dynamically rearranged or added/removed with a few mouse clicks. Some users find pivot tables intimidating at first, but after playing with them for a short while you will find them an invaluable time saver for reporting. Pivot tables also allow access to two advanced Projector reporting tools, Charts and Refresh Files.
Pivot Tables Confuse Me
If you are having trouble figuring out pivot tables then don't worry, you aren't alone. When configuring a report you will see the data and row field tabs and possibly the column fields tab.. To create the report all you have to do is ask yourself the following three questions.
Ask yourself | Maps to | Example |
|---|---|---|
What number(s) do I want? | Data Fields | I want Project Profit or I want Billable Hours. A data field is your what. |
How do I want to categorize that information? | Row Fields | I want it organized by Engagement and then Project. A row field is how you organize. |
Do I want to break down the report by time periods? | Column Fields | I want my report organized by month. A column field groups by time. |
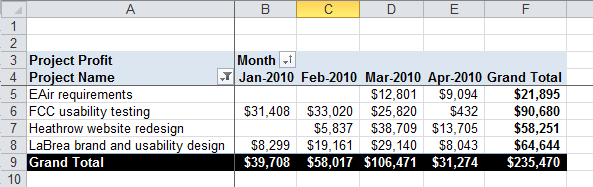
For example your statement could be - I want a report that shows Project Profit, organized by Project, and displayed by month. The Profit is the data field, the Project is the row field and month is the column field.
List of Projector Pivot Table Reports
Report |
|---|
Accounting Analysis |
Accounting Balances |
Baseline Variance |
Engagement |
Engagement Portfolio |
| Forecast Accuracy |
Ginsu |
| Project Portfolio |
| Project Role |
Task Analysis |
Utilization |
Variance |