How do I view utilization by project
To see your utilization data at the project level you will want to switch from the Utilization report to the Ginsu report.
This is one of Projector's most often asked questions. It seems like a simple request. Projector has utilization information. For instance, Charlie has 70% billable utilization and 30% non-billable utilization. Let's break his billable utilization up by project and see where that 70% is coming from. However, when you go to run your utilization report, no project fields are available. Why?!!!
To explain, you first need to be absolutely clear that utilization is a concept at the whole resource level. It can only successfully compute when looking at an individual person or a group of individuals. This tells you useful information such as Charlie is overworked, or the creative department is underutilized. What you can't do is compute utilization on a project. The problem is that projects aren't people. Projects can be over budget, they can be under budget, but they can't be 110% utilized. Another way to frame it is like this - if Sally is overutilized because she works 20 hours on one project and 30 hours on another, which project was responsible for her being overutilized?
Projector has a way of answering this question, just framed in a different way than you were expecting. To get started, let's introduce two concepts in our reporting. We call them Above the Resource and Below the Resource.
- Above the resource - Data about a single resource or groups of resources like departments. It makes sense and calculating utilization is possible.
- Below the resource - Data that rolls up into a resource. Like three projects that a resource worked on. It does not make sense and calculating utilization is impossible. If you need data at this level we recommend using Resource Equivalents (REs) instead of Utilization. Read on to learn more.
Exception
There is one exception to the above rules, if you are looking for utilization by engagement type, you can do that in the utilization report. Reason being, we move engagement type data out of row fields and into data fields. We accomplish this by creating a data field for each engagement type. So if you had five engagement types, you would have five new data fields. We can't realistically do this for every project level metric as the number of data fields needed would be enormous. As data field are always at the bottom of a pivot table, you don't need to worry about above/below the resource.
Infinity Always Shown
The <<Utilization>> "project" is categorized as non-billable by Projector. If you have any filters that remove this project from the report, then it will also remove the UBH and cause all your utilization numbers to go infinite. Make sure that on your report wizard filter fields tab and parameters tab that you aren't filtering out non-billable engagements. If you have filters setup within Excel, ensure the same.
Additional Resources
The Topic of the Day: Utilization webinar is a great resource to learn about managing and measuring resource utilization with Projector. (go to 14:21)
Am I Above or Below?
This question is a bit hard to answer without knowing your specific report requirements, so I'll provide a few example questions and then a visual tip for figuring it out.
Above the resource questions might be:
- What is the billable utilization of my consulting department? Which clients contributed to that utilization?
- What is the billable utilization of Charlie? What projects was he working on that contributed to that utilization?
- How busy are my Software Developers?
Below the resource questions might be:
- How many consultants are working on delivery projects?
- Which engagement types contribute to my utilization?
Visual Method
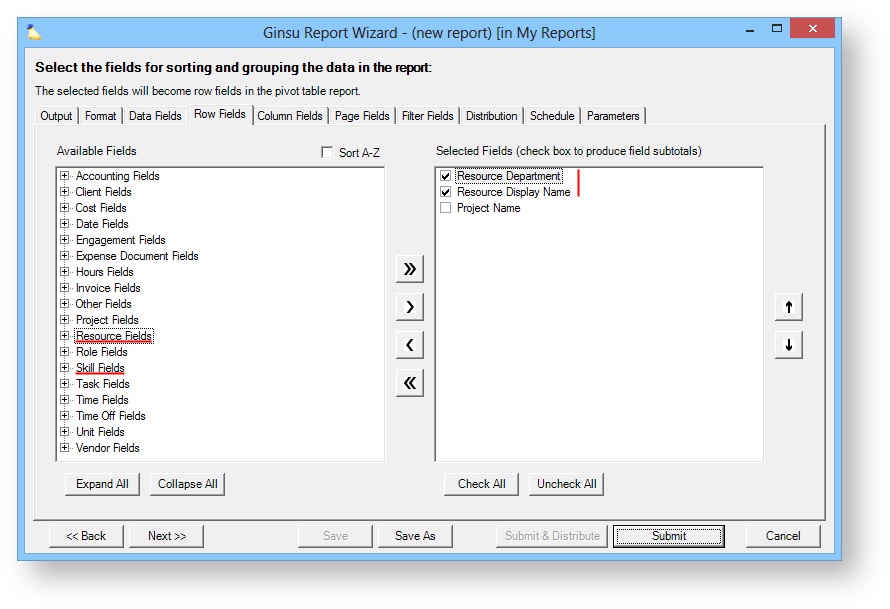
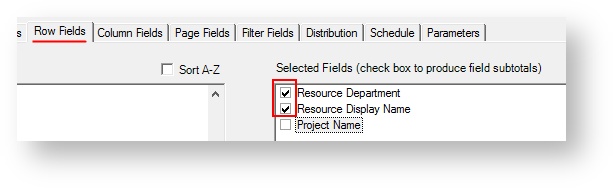
The visual way of determining whether you have above or below the resource fields is to look at your Row Fields tab. Anything that is in the Resource or Skill group is an above the resource field.
Above the Resource
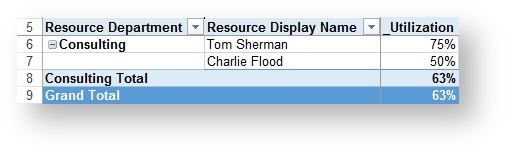
To start, remember that "above the resource" means that whole resources are grouped together and never split. You have a grouping "above the resource level" if you include a row field from either the Resource Fields or Skill Fields sections AND they are at the top of your row fields order list. As long as you are only including fields that are above the resource level, you will see utilization data properly populated as in the screenshot below. However, you should be using a utilization report if you are only looking at above the resource level fields.
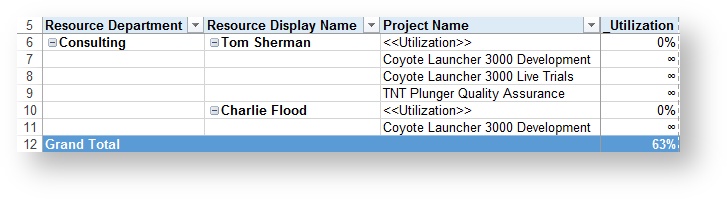
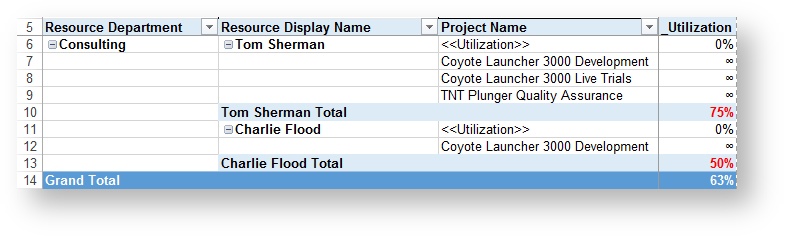
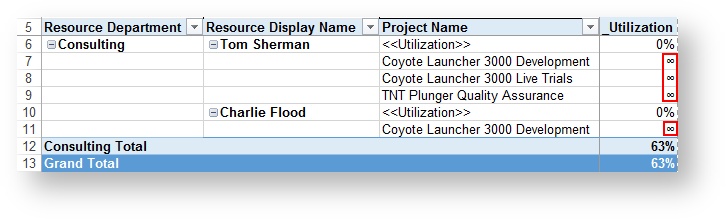
Once you add a row field below the resource level you will notice that it breaks your utilization data. Oh no, the dreaded infinity symbols!
But here is the trick, in the report wizard make sure that you tick the checkbox to subtotal by one of the "above the resource" row fields. Also make sure that these fields are at the top of the list, before any "below the resource" fields.
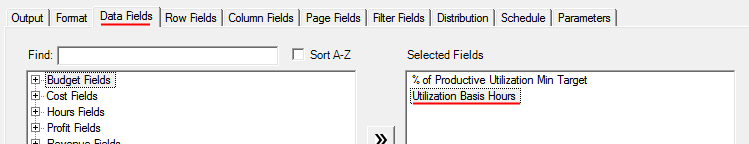
Argh! I'm still seeing infinity symbols!!! Check that under Data Fields you have included Utilization Basis Hours (or some field that brings in UBH with it like Utilization %).
These checkboxes cause subtotaling which gives us accurate results in the subtotaled rows. Now you can see Tom's utilization as well as the projects that contributed to that utilization.
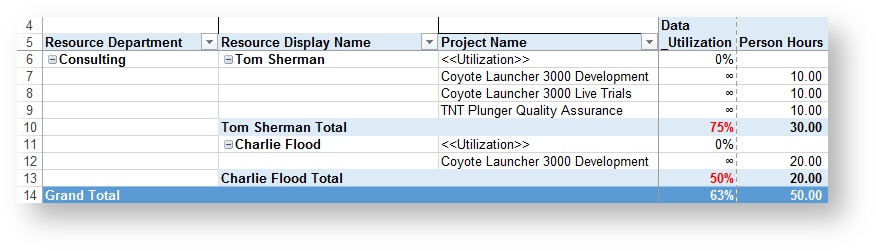
Now what you may also want to do is add in additional data fields, like Person Hours, so that you can see how many hours contributed from each project resulted in the given utilization.
Filter for Utilization Type
When you run a utilization report you'll see lots of different types of utilization listed under data fields. For example, Total, Chargeable, Billable, Non-Billable, etc. The Ginsu does not have any of these subgroups. Are you out of luck? Fortunately you are not, you just have to approach the problem differently. In a Ginsu report you include Row Fields to filter on the data points you are after. So if I want Chargeable Utilization, I need to bring in the row field called Chargeable Yes/No. When filtering on Yes or No, I get the percentages I am after. One very important thing to remember though, our previous discussion of infinite utilization numbers applies here too. So if you filter on Yes, you must also include <blank> in that filter. Otherwise our UBH gets thrown out and everything goes to infinity.
Below the Resource
In the prior section we showed how the Ginsu report can display accurate utilization numbers when you include a row field from either the Resource or Skills section of the report wizard AND it is at the top of the list. But what if you don't want to include an above the resource field? Or what if you want a below the resource field to be at the top of the list? This is what we call a "below the resource" report. In these cases Projector provides an alternate field called Resource Equivalents.
A resource equivalent (RE) is similar to, but not the same, as a Full Time Equivalent (FTE). The RE is 1 if the resource is 100% utilized. If the resource works half-time then the RE is 0.5. The RE for a group of resources is the sum for each. Therefore, if one person's RE is 0.75 and the other's is 1.0, then the total is 1.75. Resource equivalents allows you to understand how busy a resource is on each project, as a fraction of that resource's capacity. FTEs are different in that they allow you to understand capacity in terms of the capacity of a "typical" resource, meaning someone that works the normal working hours of a location, without considering any resource-specific non-standard working schedule, such as someone that works only 4 days each week.
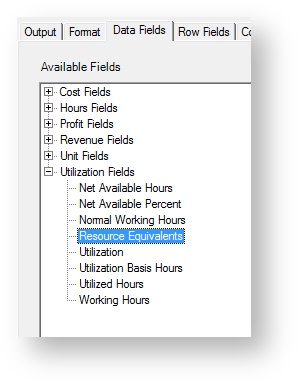
Resource Equivalents are also useful for measuring demand. You might want to know how many consultant REs you require for the coming week. You will find Resource Equivalents under the data fields tab.
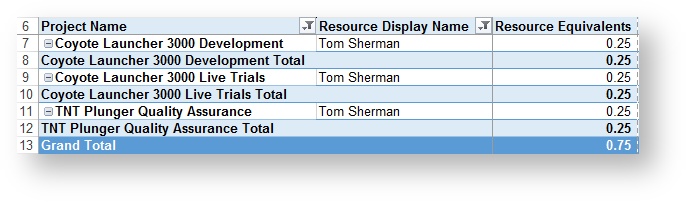
In the screenshot below I have shown RE for each project Tom is working on. This shows me how much of his time is spent on each project. Currently he is spending equal time on each of the three projects.
Infinity Utilization
If you have followed the instructions above, but are still seeing infinite utilization, then you'll find this section useful.
When you've run a Ginsu report you may see infinite utilization in some of your line items.
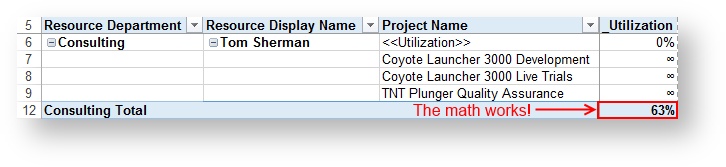
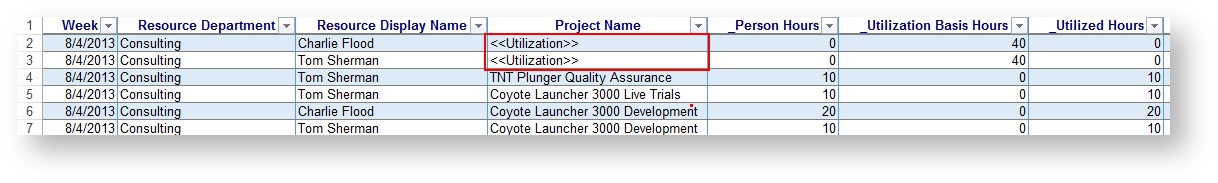
If you will recall, utilization is Utilized Hours / Utilization Basis Hours (UBH). As we all know from grade school math, when the denominator is zero, you get infinity. So why is the denominator (UBH) zero? We have to look at the backend data that drives a pivot table to find out why. Pivot tables are driven by a flat spreadsheet in the background. For the table above, it would look something like this. Note in rows 2 and 3, center column, that we have a fake project called <<Utilization>>.
This fake project is where the denominator/UBH is stored. Now hopefully you follow me through this next part. Why is the UBH on a fake project? Well, Projector can't know your UBH on individual projects. So it can't split the forty hours up. Would UBH get split evenly? Based on how much time you worked on each project? Based on bookings? Each would skew what utilization meant, and so we don't show it. We could put the same UBH of forty into every project, but this introduces a new problem. When aggregating data for all your projects, your UBH would be giant. For example, if you worked on three projects, when aggregated at the engagement level your UBH is suddenly 120. Well that doesn't make sense either!
So instead, Projector adds a fake project that must be combined with your other projects. The fake project contains the UBH denominator in the utilization equation. The numerator is drawn from the real projects. When combined together the math works. In the screenshot below you can see that each project has 0/infinite utilization on their own, but when combined in the consulting total, the math works.