Report Web Services
Report web services are a means of accessing your report data through the internet using a URL. This is extremely useful for building customized Excel spreadsheets that automatically refresh with data from Projector. Your customized spreadsheet will retain all your custom formatting and calculations, removing the busy work of reformatting it every time. It is also great for aggregating multiple Projector reports into one spreadsheet. Finally, the web services let you access your data in a number of different formats like XML and JSON - allowing you to pull and parse data into Business Intelligence tools to extend the power of our reporting engine.
Report data is stored in a number of formats and is accessible via RESTful requests. That may sound intimidating, but some of your favorite tools, like Excel and Google Docs, have built-in support for accessing online report data. Many third party BI tools can also directly consume this information. In addition, the Projector staff can help you build applications around the web services as part of our consulting services.
- Excel - Import CSV
- Excel - Import XML
- Google Sheets - Import CSV
- Google Sheets - Import XML
- Power BI - Import CSV
Our RESTful web services are read-only. If you require CRUD access to Projector you will need to use our SOAP-based APIs.
Additional Resources
Watch the Projector Web Services Webinar to learn about the APIs provided by Projector and best practices around their use.
In Topic of the Day: Advanced Reporting webinar, we look at some advanced reporting techniques within Projector, including reporting web services.
- The Report Customization Webinar, is a workshop on report customization techniques. In the webinar we walked through the process of creating custom reports that can be used on a reoccurring basis.
- Introduction to Projector Web Services webinar is a great resource providing an introduction to Projector's web services and highlighting some examples of its use.
Create a Report
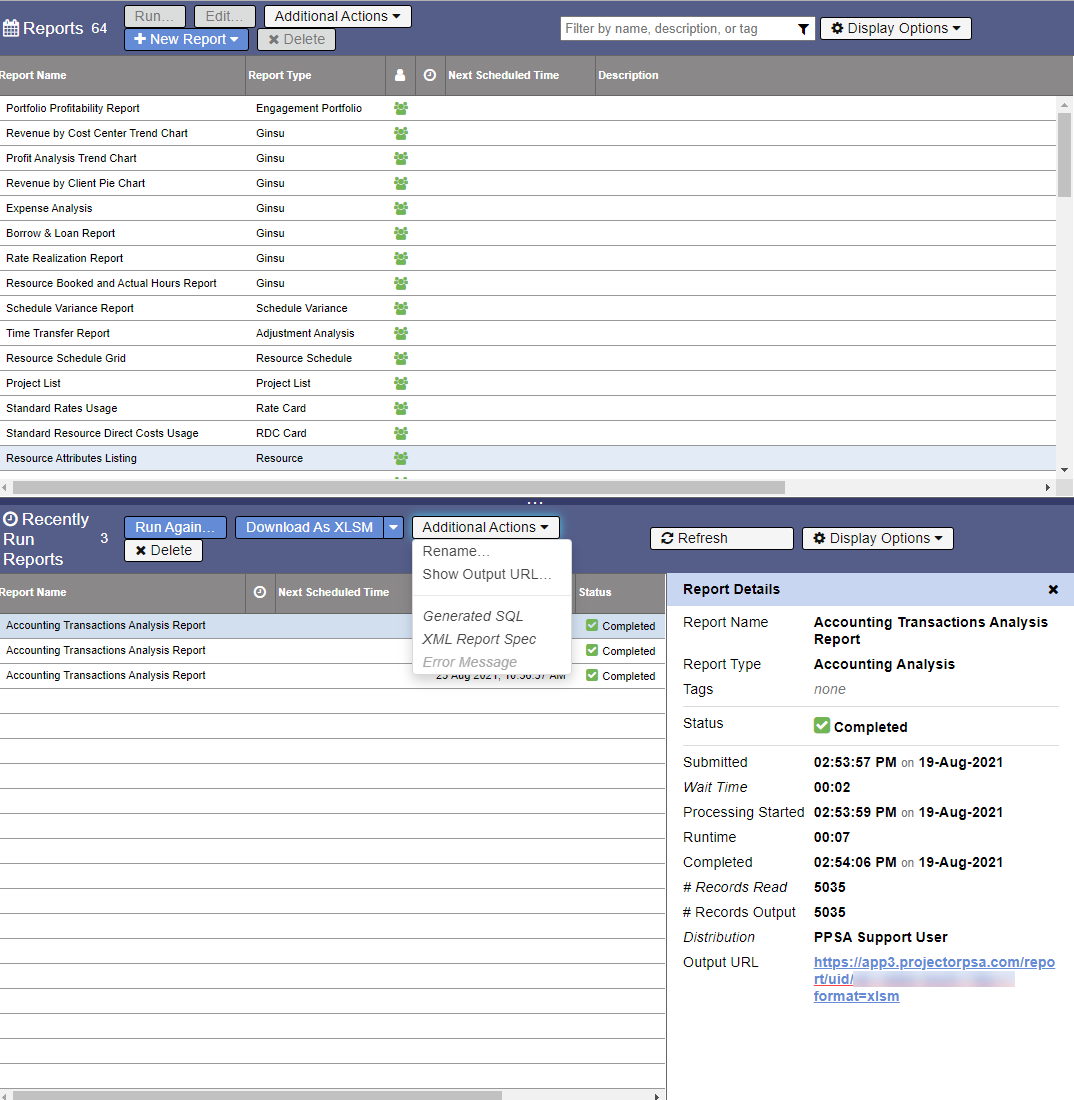
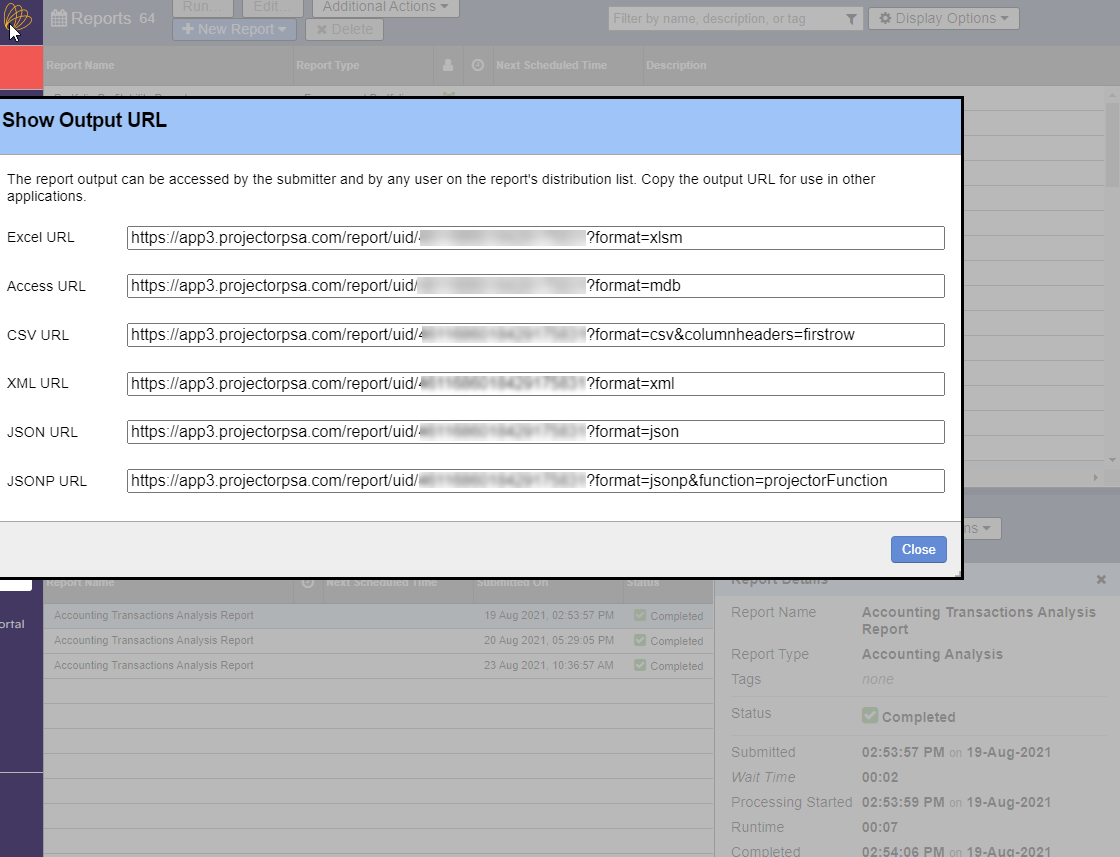
Web service reports are a seamless extension of our existing report engine. Every report you run in Projector is assigned a unique URL. You can find this URL by selecting a finished report and choosing Additional Actions | Show Report Output URL. This displays a dialog like the one below. Notice that we have a special link for each file format you might want the data in - excel, xml, csv, etc. You can cut and paste these URLs into a web browser to download or view the output. Or cut and paste them into other programs like Excel, Google Docs, or a Business Intelligence tool to consume them.
|
|
|---|
Web Service Codes
The unique URLs displayed above are great if you want to access just this one report, but what if you want to run a saved report once a week? You don't want to go into Projector every time and find the new, unique URL. To handle this, we have what is called a Web Service Code. The first tab on any report is called Output, and is where you specify the web service code. With this code, we create a special link that stays the same no matter what. Now every time you rerun the same report, the data behind the URL gets refreshed. This is incredibly useful for creating dashboards or reports that automatically update. Two example links are below. The first link uses a web service code and always fetches the most recent report run. The second link uses a unique identification number and can only fetch a single report run.
https://app2.projectorpsa.com/report/code/MyReportCode?format=xml
https://app2.projectorpsa.com/report/uid/1152938409871092892?format=xml
Web service codes try to be intelligent. Imagine a case where two people run different reports, both with the same web service code ''abc123." When you ask Projector for the report data, whose report do you return? The answer depends on who requests the report. Projector tries to match the code with whoever requested it. There is one important exception to keep in mind though. You can distribute a report to other people. There is the potential to step on some toes here. If you have a personal report using code "abc123" and someone distributes a report using code "abc123" then whoever ran the report last "wins." Try and make sure that you are using unique web service codes where appropriate. Perhaps by pre-pending your username to the code.
Authentication
In order to access a report over the web, you have to prove that you are allowed access to it. You are allowed access if either is true:
- You ran the report
- Are on the distribution list of the report
AND you have authenticated with Projector. There are there ways to authenticate
- Enter the report URL and Projector will ask you to login with your username and password
- Enter the report URL and provide your username and password in the URL
- Enter the report URL and provide a session ticket
- Enter the report URL and provide a special authorization token that proves you are allowed access
Account Security
The last option, an authorization token, is the recommended approach if you have a report that is viewable by multiple users or if it needs to be consumed by a business intelligence tool. This prevents a user's personal credentials from being compromised.
QueryString Parameters
Now that you've learned the basics of how report web services work, we can get into some more advanced aspects of them. Every report URL has the option of adding "querystring" parameters to the end. These parameters specify additional details about how you want your report data returned. For example, you can append your username and password to a report so that you don't need to log into Projector to download the report data. These are added by appending an ampersand (&) and the name/value pair. Example:
?format=xls&AccountCode=revcorp&UserName=tom@projectorpsa.com&Password=monkeys
A full listing of querystring parameters.
Parameter | Values | Description | Example |
|---|---|---|---|
| AuthToken | Equal to the value specified in the report wizard | Access the report using a unique token instead of a password. Strongly recommend that this method is used if this report is shared between multiple Projector users or with business intelligence tools to prevent your password from being compromised. To use this option, you must have authorization tokens enabled in your Account Settings Editor. Must be used in conjunction with the querystring parameter username. | AuthToken=0c6d403d-70be-4450-a1fc-b96b7f70eb78 |
AccountCode | Equal to your Account Code | If you have multiple installations of Projector with identical usernames, then an account code is required. | AccountCode=revcorp |
UserName | This is the username you enter when logging into Projector. Must be used in conjunction with a password or authtoken querystring parameter | UserName=tom@projectorpsa.com | |
Password | This is the password you enter when logging into Projector. Must be used in conjunction with a username querystring parameter. | Password=monkeys | |
SessionTicket | SessionTicket can be used instead of a UserName/Password or Username/AuthToken combo. SessionTickets are obtainable through a SOAP request as defined in our C Sharp Example. | SessionTicket=--==kljadf9893j4k3j41090fjkdk | |
Format |
| Specifies the format of the file. For import into Excel or Google Docs you probably want to use XML. For import into a web-based dashboard you probably want json or jsonp. | Format=xlsm |
| ExplicitFieldsOnly | yes | Specify yes if you want only the data fields you specified brought in. Otherwise we may leave out some fields and bring in different ones instead. The explanation below covers when and why this happens. Projector's original reporting engine used Microsoft Excel to calculate some fields. For example, if you wanted to get Rate, we would bring in Hours and Revenue. When divided, they give you rate. The benefit to this was two fold. First, we let Excel do the heavy lifting of performing calculations instead of our database. Second, pivot tables can more accurately model rolled up data by calculating the field out to nth precision. When report web services were initially introduced we could not calculate these fields for you. Instead, we only provided the source data values. So if you requested Rate, we would give you Hours and Revenue instead. Calculating the Rate was an exercise left to the user. A lot of time has passed since then, so now you have a choice. You can request the raw data values by adding this querysting parameter and setting it to yes, or you can get the old behavior where a field is left out and you get the constituent parts of the formula instead. | |
DateFormat | googledocs C# string like dd-MMM-yyyy | By default dates are returned in SQL format - 2011-01-23T00:00:00 . In order to be compatible with Google Docs, this parameter replaces the "T" with a space. You can also pass in your own formatting string. For example, dd-MMM-yyyy would output as 10-Dec-2014. For a full list of formatting parameters, please see this article. | DateFormat=googledocs |
ColumnHeaders | firstrow | Return column headers (field names) in the first row. For example, if your report contains WorkDate and ResourceDisplayName, then first row might include 01/01/2012 and John Doe. By specifying this parameter you indicate that the first row should contain field names instead of field values. So the first row would instead be WorkDate, ResourceDisplayName and the second row would be 01/01/2012, John Doe. | ColumnHeaders=firstrow |
| Function | Any valid javascript function name | This parameter is to support JSONP formats. The return JSON will be wrapped in the specified function name. If this parameter is not specified, then we wrap it in projectorFunction by default. | Function=myJSONPCallback |
| OnFail | HttpStatusCode | In the event that Projector fails to retrieve the specified report data, don't return a 200 response and forward the user to a response page. Rather, return the appropriate http status code. For example
This can be important when pulling Projector data into third party reporting engines. They may improperly interpret a 200 response a success, when really the data is bad. For end users who access report data via Excel, their browser, or other interfaces with a UI, likely appreciate the default behavior. | |
| AAMGantt | yes | Only affects .csv files. Causes the file exported from Projector to use a special column format which our /wiki/spaces/docs/pages/12915465 can process. In a typical pivot table we break tasks up by their task depth. So a top level task gets grouped into a column called Task Level 1. Child tasks can end up in Task Level 2, 3, etc. This is useful when viewing Gantt chart data in pivot tables, but wreaks havoc on the AAM import engine since there can be a completely arbitrary number of Task Level columns. The AAM likes a fixed number of columns. Specifically this flag adds two new columns to the end of the report. They are Leaf Task and Ancestor Task. Leaf task is the current task's WBS code + name. Ancestor task is the immediate preceding ancestor. To learn more about how you can build Gantt charts in AAM, see /wiki/spaces/docs/pages/12913009. In addition, it removes the columns that are only required for pivot tables. These columns use the naming convention Task Level N. | |
| IncludeEmpty | yes | If no data exists in the report, setting this parameter to yes will cause Projector to return an empty report with just a header row and no data rows when a CSV format is requested. It doesn't have any effect when any of the other file formats are specified. |
In Practice
So if you've skipped through all the above mumbo jumbo, this is the super short version of getting this working.
Here is an example of a full report URL.
- Run your own report and fill in a web service code on the output tab as talked about above. Note the:
- Web service code
- Your account code (found in bottom left of management portal)
- Your username
- Your password
- Substitute the above information into the example URL
- Cut and paste it into a web browser
- You'll see your data displayed in XML format
Now let's put this report data to use in Excel. See the Excel - Import XML help page to learn how to map this URL directly into an Excel.
Calculated Fields
You are probably used to some fields in Projector automatically calculating in Excel spreadsheets. For example, if you pull rates into an Excel report, they will be correct. However, this is because Projector Excel reports include macros that add calculated fields which do this math. When you pull raw data like XML, then Projector only provides the base data, not the actual rate values. Normally, you'll need to add these calculations yourself. If you do want to pull in these calculated fields, see the ExplicitFieldsOnly parameter above.
UIDs
There are two types of report UIDs. They are frequently confused, so you should take a minute to memorize the distinction.
First, we have Report Spec UIDs. This UID identifies a saved report in the upper section of the reports tab. It is used along with our SOAP based web services to initiate a new report run. You can retrieve this UID by right clicking a report in the Upper section and choosing Advanced | Show Report Spec ID.
Second, we have Report Output UIDs. This UID identifies a report that you ran. These are displayed in the lower section of the reports tab. They are used by report web services (this page) to retrieve a finished report.