Task Analysis Report - Data Fields
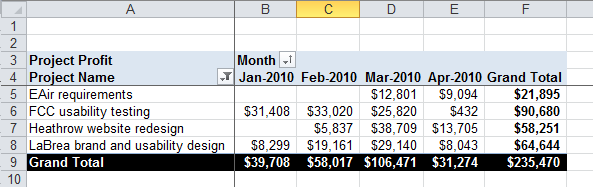
In Projector a data field represents the information that you are interested in. For Excel Pivot Tables this information can be cross-referenced by the row and column fields to compile the data. In this image you see project profit organized by project name and month. Project Profit is the data field. Project Name is the row field. Month is the column field. If this sounds confusing, read our introductory article on pivot tables.
Data Fields
Field | Category | Description |
|---|---|---|
% Complete | Task Status Fields | Hours to date / Hours at completion |
% Elapsed | Task Status Fields | Percent of working days for each task elapsed as of the actuals cutoff date |
Actual Cost (ACWP) | Earned Value Fields | Actual cost (also known as Actual Cost of Work Performed); approved hours spent on task through actuals cutoff date |
Actual End Date | Peformance to Schedule Fields | If task is completed, date of last time card on task or the task completion date if there are no time cards |
Actual Start Date | Peformance to Schedule Fields | Date of first time card on task or the task completion date if there are no time cards |
Baseline End Date | Peformance to Schedule Fields | End date of task on current active task baseline |
Baseline Start Date | Peformance to Schedule Fields | Start date of task on current active task baseline |
Budget Status | Peformance to Budget Fields | Status of task(s) as compared to budgeted hours on current active baseline (on budget, over budget) |
Budget Variance | Peformance to Budget Fields | Hours at completion - Budgeted hours (positive is over budget, negative is under budget) |
Budget Variance % | Peformance to Budget Fields | Budget variance / Budgeted hours (positive is over budget, negative is under budget) |
Budgeted Hours | Peformance to Budget Fields | Hours budgeted on task on current active task baseline |
Budgeted Hours Remaining | Peformance to Budget Fields | Budgeted Hours - Hours to Date |
Cost Performance Index | Earned Value Fields | Ratio of how much the accomplished work should have cost versus how much it actually cost; Earned value / Actual cost (greater than 1 is under budget, less than 1 is over budget) |
Cost Variance | Earned Value Fields | Comparison of the actual cost of the work completed as compared to how much that work should have cost as measured in hours; Earned value - Actual cost (negative is over budget, positive is under budget) |
Earned Value (BCWP) | Earned Value Fields | Number of hours the project has "earned" based on percent of work completed (also known as Budgeted Cost of Work Performed); % complete X Budgeted hours |
Hours at Completion | Peformance to Budget Fields | Actual Hours to Date + Task Remaining Hours |
Hours Remaining | Peformance to Budget Fields | Remaining hours left to complete task |
Hours to Date | Peformance to Budget Fields | Approved hours spent on task through actuals cutoff date |
Planned End Date | Peformance to Schedule Fields | End date of task on current task plan |
Planned Start Date | Peformance to Schedule Fields | Start date of task on current task plan |
Planned Value (BCWS) | Earned Value Fields | Number of hours of work that should have been completed to date based on elapsed time (also known as Budgeted Cost of Work Scheduled); % elapsed X Budgeted hours |
Schedule Performance Index | Earned Value Fields | Ratio of how much work actually was accomplished versus how much should have been completed; Earned value / Planned value (greater than 1 is ahead of schedule, less than 1 is behind schedule) |
Schedule Status | Peformance to Schedule Fields | Status of task as compared to start and end dates on current active baseline (on time, late) |
Schedule Variance | Earned Value Fields | Comparison of the amount of work that should have been completed to date versus how much work actually was completed to date; Earned value - Planned value (positive is ahead of schedule, negative is behind schedule) |
Task Baseline Duration | Peformance to Schedule Fields | Number of working days between a task's baseline start and baseline end dates |
Task Planned Duration | Peformance to Schedule Fields | Number of working days between a task's planned start and planned end dates |
Task Status | Task Status Fields | Completion status of task (not started, started, finished) |
Planned vs. Baseline vs. Actual
When looking at start date, end date, and duration you'll see that they are broken out into three categories. Planned, Baseline, and Actual. This section describes the differences between the three.
- Planned - values are based on your current plan. To edit planned values, edit your tasks and change their start dates, duration, or effort. The report will update accordingly.
- Baseline - values are based on your active baseline. You can't really "edit" baseline values like you can planned values. Rather, you would make a new baseline that is a snapshot of your current plan.
- Actual - values are based on the first and last time cards entered against this task. You can't really "edit" these values either. The only way to do that would be to go in and change the work dates of your time cards. Or approve new time cards.
Often planned and baseline values match. Reason being, it is good practice to keep your current, active baseline in sync with your plan. When they differ it is because your baseline is out of date.