Utilization Report
The Utilization Report focuses on resources and displays their utilization by percent, hours, whole resource profit, and missing time. By understanding the notion of a "whole resource" this report can tell you not only what your people are working on - billing vs. selling - but also what portion of their time is as yet unaccounted for. This unaccounted for time could represent availability when it is in the future or a missing timesheet when it is in the past. The utilization report also understands what it means to be a salaried employee... that you will get paid the same amount whether you worked 6 hours last Monday or 12. As such, while the utilization report is obviously a good place to start if you want to understand utilization, it's also a great source of information about whole resource profitability, availability, and time entry compliance.
If you are interested in tracking utilization at the project level, please see How do I view utilization by project? The only exception being for utilization by engagement type. You can do that here.
Additional Resources
- Watch this e3 webinar, Topic of the Day: Utilization for an overview on Utilization in Projector.
- Watch this webinar, Time Compliance Best Practices[start from 19:38], to learn where to find missing time.
Who this report is for
Operations and resource managers are the principal consumers of utilization reports.
Permissions and Settings
The ability to run this report is driven by the cost center permission Run Utilization Report.
Questions this report can answer
Question | Answer |
|---|---|
Are my hourly employees overworked? | By running a capacity based utilization report you can see whether your hourly workers are above or below 100% utilization. If you find some are greater than 100% then you may be overworking them. |
Do I need to add or reduce resources? | By running a capacity based utilization report you can see whether your employees are under/over capacity - allowing you to see whether you need to add to or reduce your work force. |
Who are my most productive workers? | By running a yield management utilization report you can see whether you are getting 100% yield, < 100% or > 100% out of your workers. You can add in data fields for Resource Margin and Resource Profit to break down their productivity even further. |
Are some workers not pulling their weight? | By running a capacity based utilization report you can find employees who are underutilized. |
Utilization Basis Hours, Yield and Capacity
Additional Resources
The Topic of the Day: Utilization webinar is a great resource to learn about managing and measuring resource utilization with Projector. (go to 14:21)
Utilization Basis Hours
One of the key ideas of a utilization report is called Utilization Basis Hours (UBH). UBH is a fancy way of saying these are the number of hours I expect my employees to work. So if an employee has a 40 hour work-week then their UBH would be 40. Things like holidays and time off can affect this number. Once you know how many hours you expect your resources to work you can start calculating how effectively they are utilized. For example if a resource worked 20 hours for a 40 hour work week then you know they were only half used. See the Permissions and Settings section below to learn more about how your UBH is calculated.
Full Time Equivalents
Full Time Equivalents (FTE's) are a unique concept to utilization reports. FTE is a means of measuring on a person basis as opposed to an hours basis. To learn more about FTE's and how they can help your organization please see the Measuring Utilization how-to.
Yield vs. Capacity
Another key idea of utilization reports is the calculation method, Yield or Capacity. If you are running a report it is very important to understand which of the two you are using and why. Yield shows you how much you are getting out of your workforce compared to what you pay them. Capacity shows you how much you are getting out of your workforce compared to what they can do. The simplest comparison between the two is someone you reimburse hourly. An hourly person only gets paid when they work. So their yield is always 100%. Doesn't matter if they work zero hours, one hour, or a hundred hours in a week. Capacity shows how much you are getting vs. what they could be doing. If that hourly employee only works one hour, then there are 39 more hours in the week they could have worked. They are 1/40 utilized. The two methods answer very different questions.
The chart below explains these two concepts.
Calculation Method | Description |
|---|---|
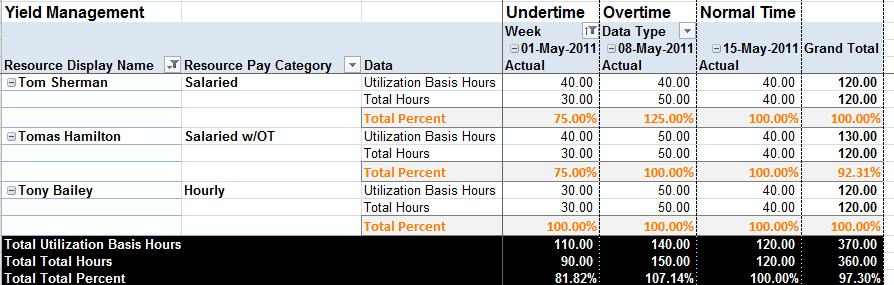
Yield Management | How much work are you getting out of your delivery organization as compared to what you are paying for? If a user worked many hours, but generated very little revenue then they have a low yield. The calculation is based upon how resources are compensated.
|
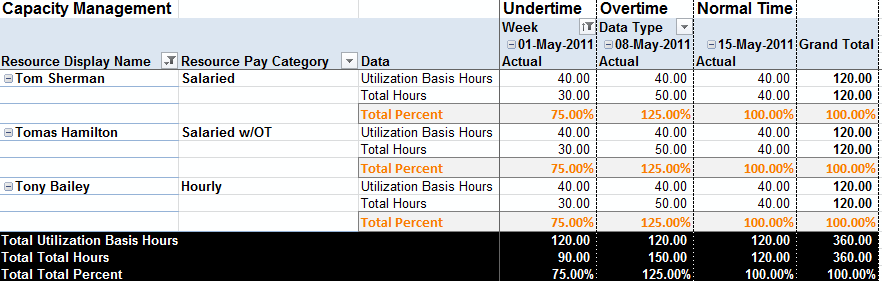
Capacity Management | How much work are you getting out of your delivery organization as compared to what the full potential is? If you have many employees who are available, but not working, then you are running under capacity.
|
Permissions and Settings
This report requires the cost center permission Run Utilization Report.
Permission or Setting | Description |
|---|---|
Calculate RDC Basis as | A system setting that controls how the Utilization Basis Hours (UBH) are calculated for Yield |
| Calculate Capacity-Based Utilization Basis Hours As | A system setting that controls how the Utilization Basis Hours (UBH) are calculated for Capacity |
Calculate Utilization For | A system setting that controls whether Yield or Capacity is the default utilization measurement. This setting can be overridden on a per report basis from the parameters tab. |
Resource Direct Cost (RDC) Data | Global permission required to view the following report data fields - Resource Direct Cost, Resource Direct Rate, Resource Margin, Resource Profit and Resource ROI. Must be used in conjunction with the Financial Data in Utilization Reports permission. |
Financial Data in Utilization Reports | Global Permission required to view the following report data fields - Resource Direct Cost, Resource Direct Rate, Resource Margin, Resource Profit and Resource ROI. Must be used in conjunction with the* Resource Direct Cost (RDC) Data* permission. |
Include Engagements of this type in Busy Hours on Utilization Reports | An engagement type setting that governs whether an engagement affects utilization busy hours. |
Prebuilt Reports
Your installation may include the following prebuilt reports.
Report | Description |
|---|---|
Resource Availability | Gain insight into how busy your employees are in the future. View available % and available hours broken down by billable, busy and total available. See data fields to learn more about the difference between billable, busy and available hours. |
Billable & Missing Hours | Find out how much billable time or missing time has been reported. |
Utilization by Engagement Type | View percent time spent and hours spent on General and Administrative, Pitch and Training engagements. If you wish to add additional engagement types then you can do so from the Hours Fields area. |
Utilization by Cost Center Trend Chart | View a line chart of the % of billable work broken down by cost center. |
Utilization by Department Chart | View a column chart of the percent time spent on G&A, Training and Pitch engagements by resource department. |
Hours by Cost Center and Department Chart | View a stacked column chart showing how many billable hours each department generates for each cost center. Useful for visualizing how many billable hours each department generates per cost center. |
Billable Hours by Department Trend Chart | View a stacked area chart showing billable hours by department. Visualize how many billable hours each department is generating. |
Hours by Engagement Type Chart | View a pie chart showing G&A, Pitch and Training hours. |
FAQ
How do I track whether my resources are reporting enough billable hours?
Organizations often require their resources to report a minimum number of billable hours per week or month.
- On the parameters tab set the Calculate Utilization for dropdown to yield.
- Add the following row field to your report:
Row Field
Resource Display Name
- Add the following data fields to your report:
Data Field
Description
Billable Type Hours
The number of billable hours
Billable Type Percent
Percentage of UBH dedicated towards billable work
- Optionally add these additional data fields:
Field
Description
Nonbillable Type Hours
The number of nonbillable hours
Nonbillable Type Percent
Percentage of UBH dedicated towards nonbillable work
Missing Type Hours
Similar to billable/nonbillable described above
Missing Type Percent
Similar to billable/nonbillable described above
Total Hours
Total of billable and nonbillable hours
Total Percent
Percent that is yielded. If less than 100% then resources could be reporting more hours. If more than 100% then they are working more than expected.
From the resulting report you will see the total number of billable hours and what percent of their time is dedicated to billable work. We have also included nonbillable time and total time so that you can see whether the reason for not meeting their billable requirements are because of missing time or nonbillable time. Finally we include total hours/percent so that you can see if your resources are overworking themselves to meet billable requirements.